
Date & durée : 2021 – 3 semaines
Compétences : Visualisation de données – Suite Adobe – Excel – OpenRefine – RawGraph
Brief : Résumer les résultats d’une recherche dans un langage visuel. Répondre à une question de recherche à l’aide de la visualisation des données.
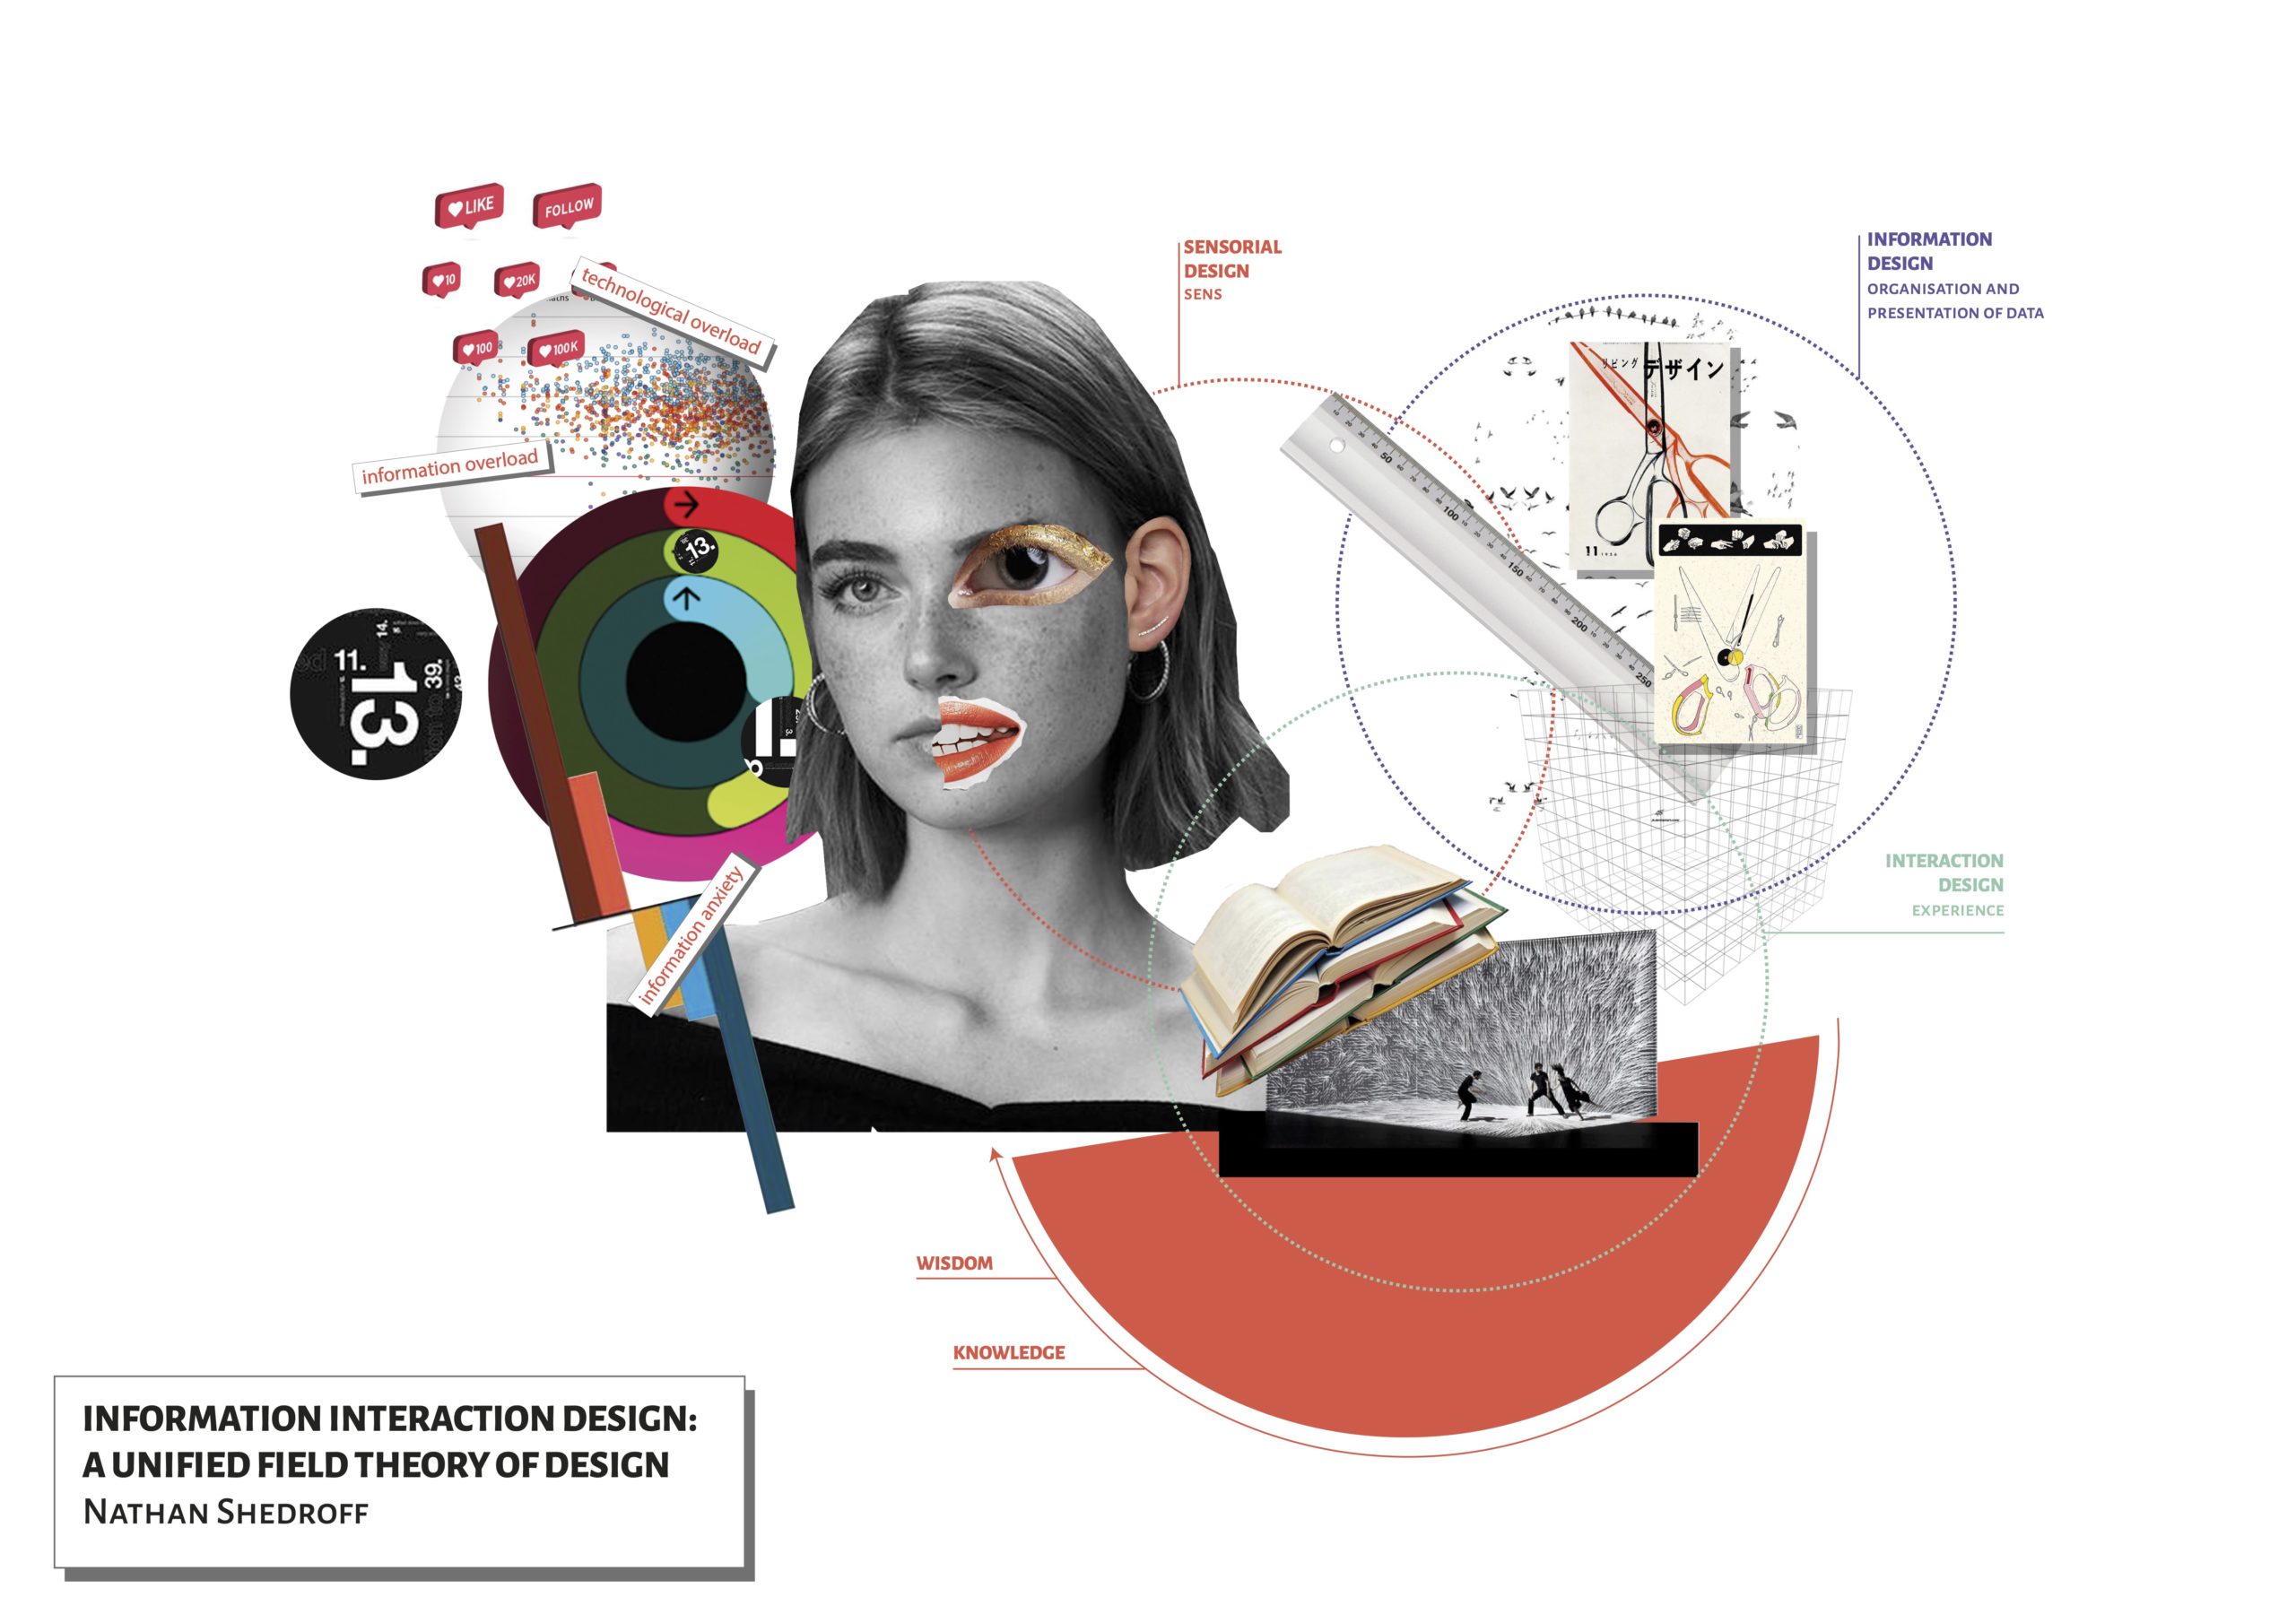
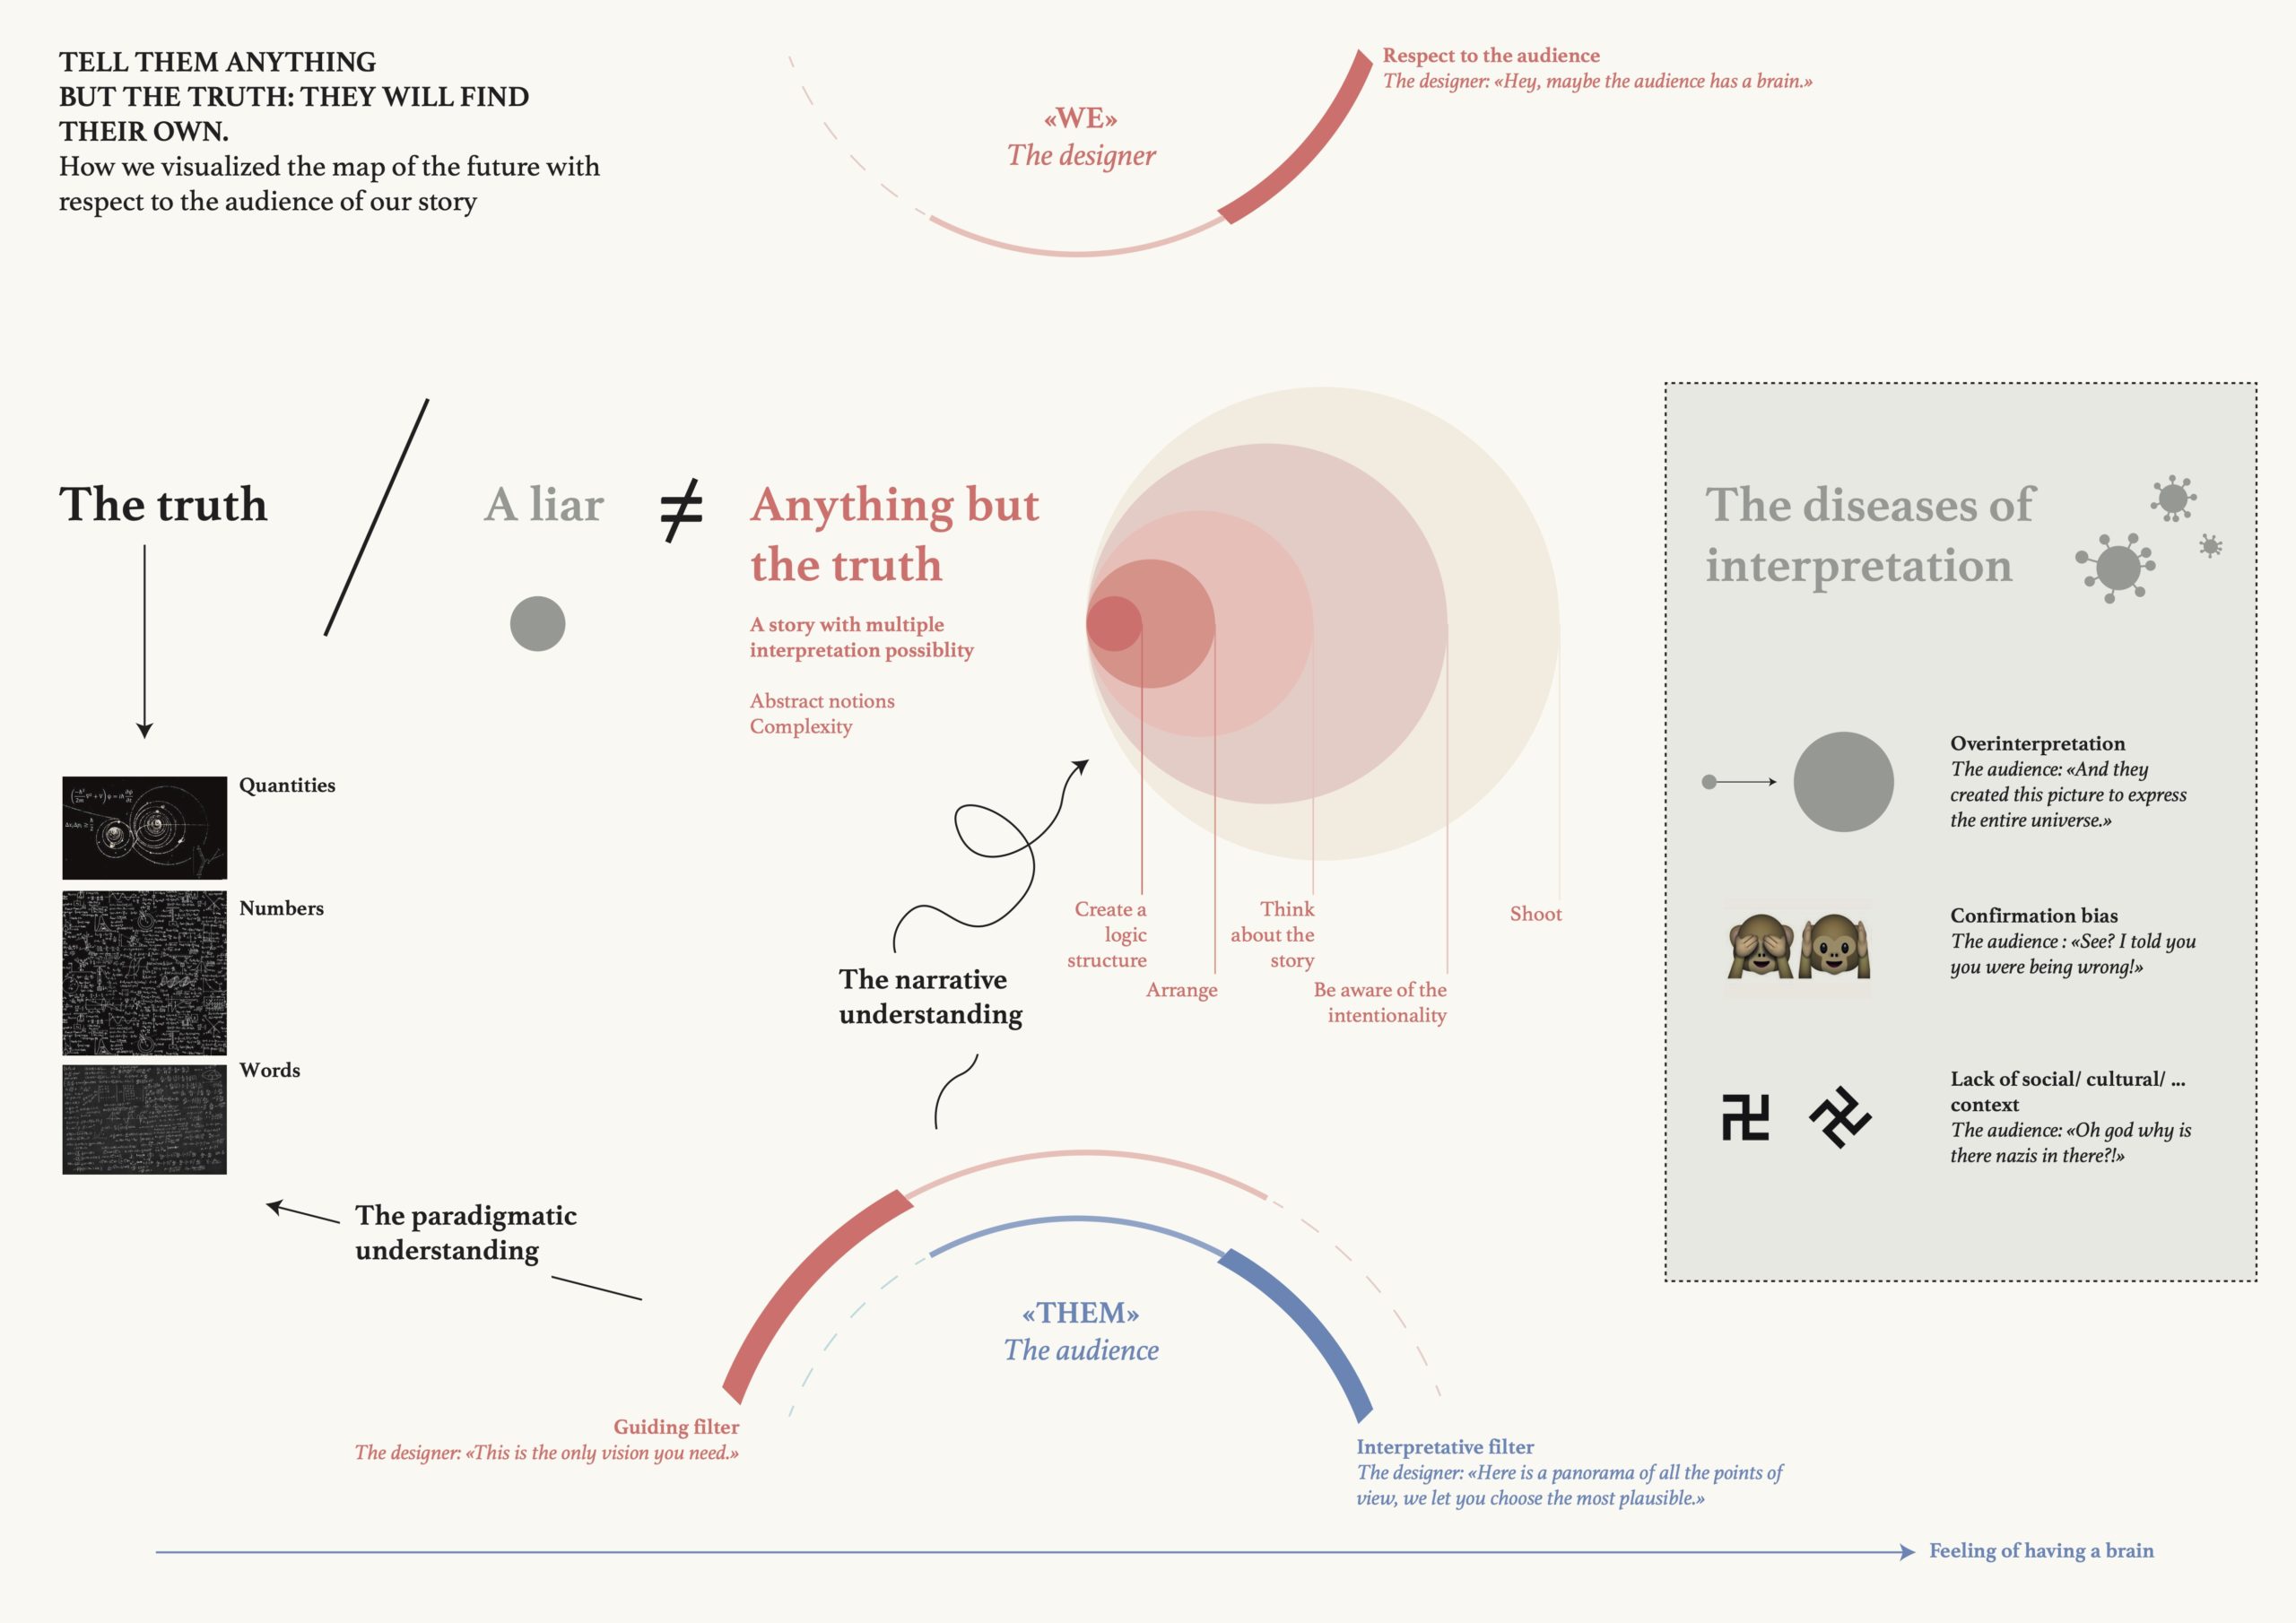
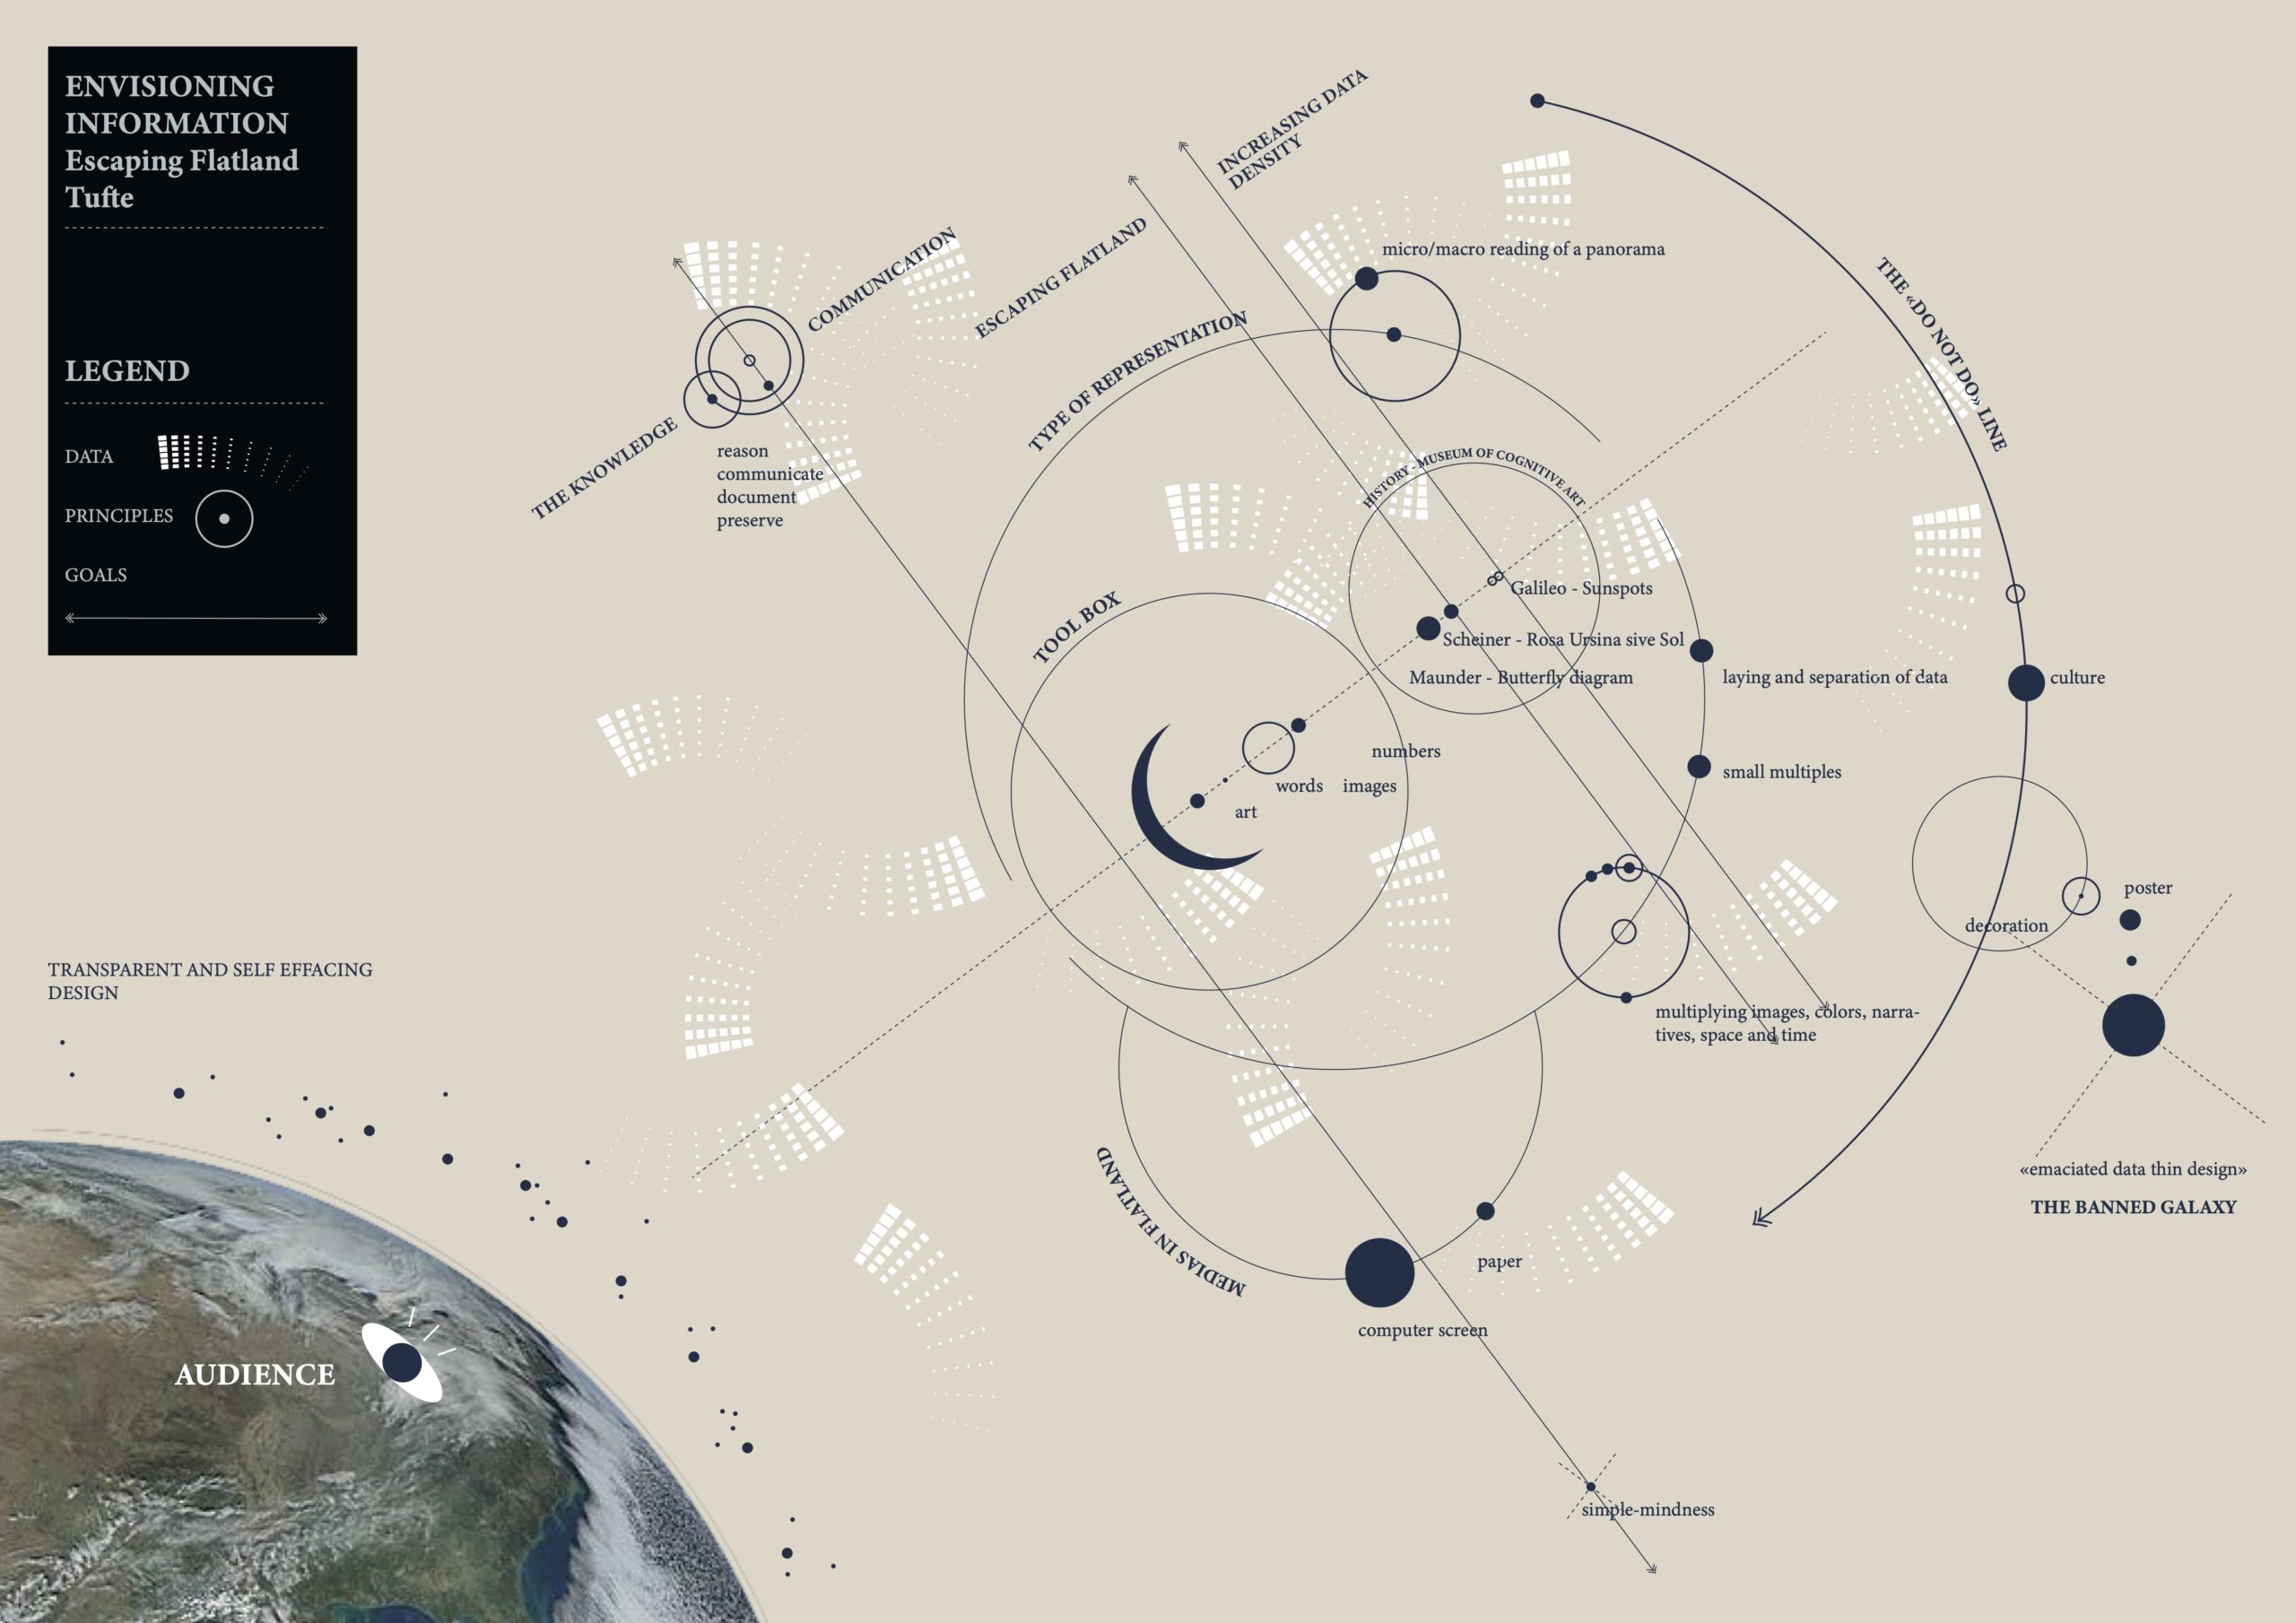
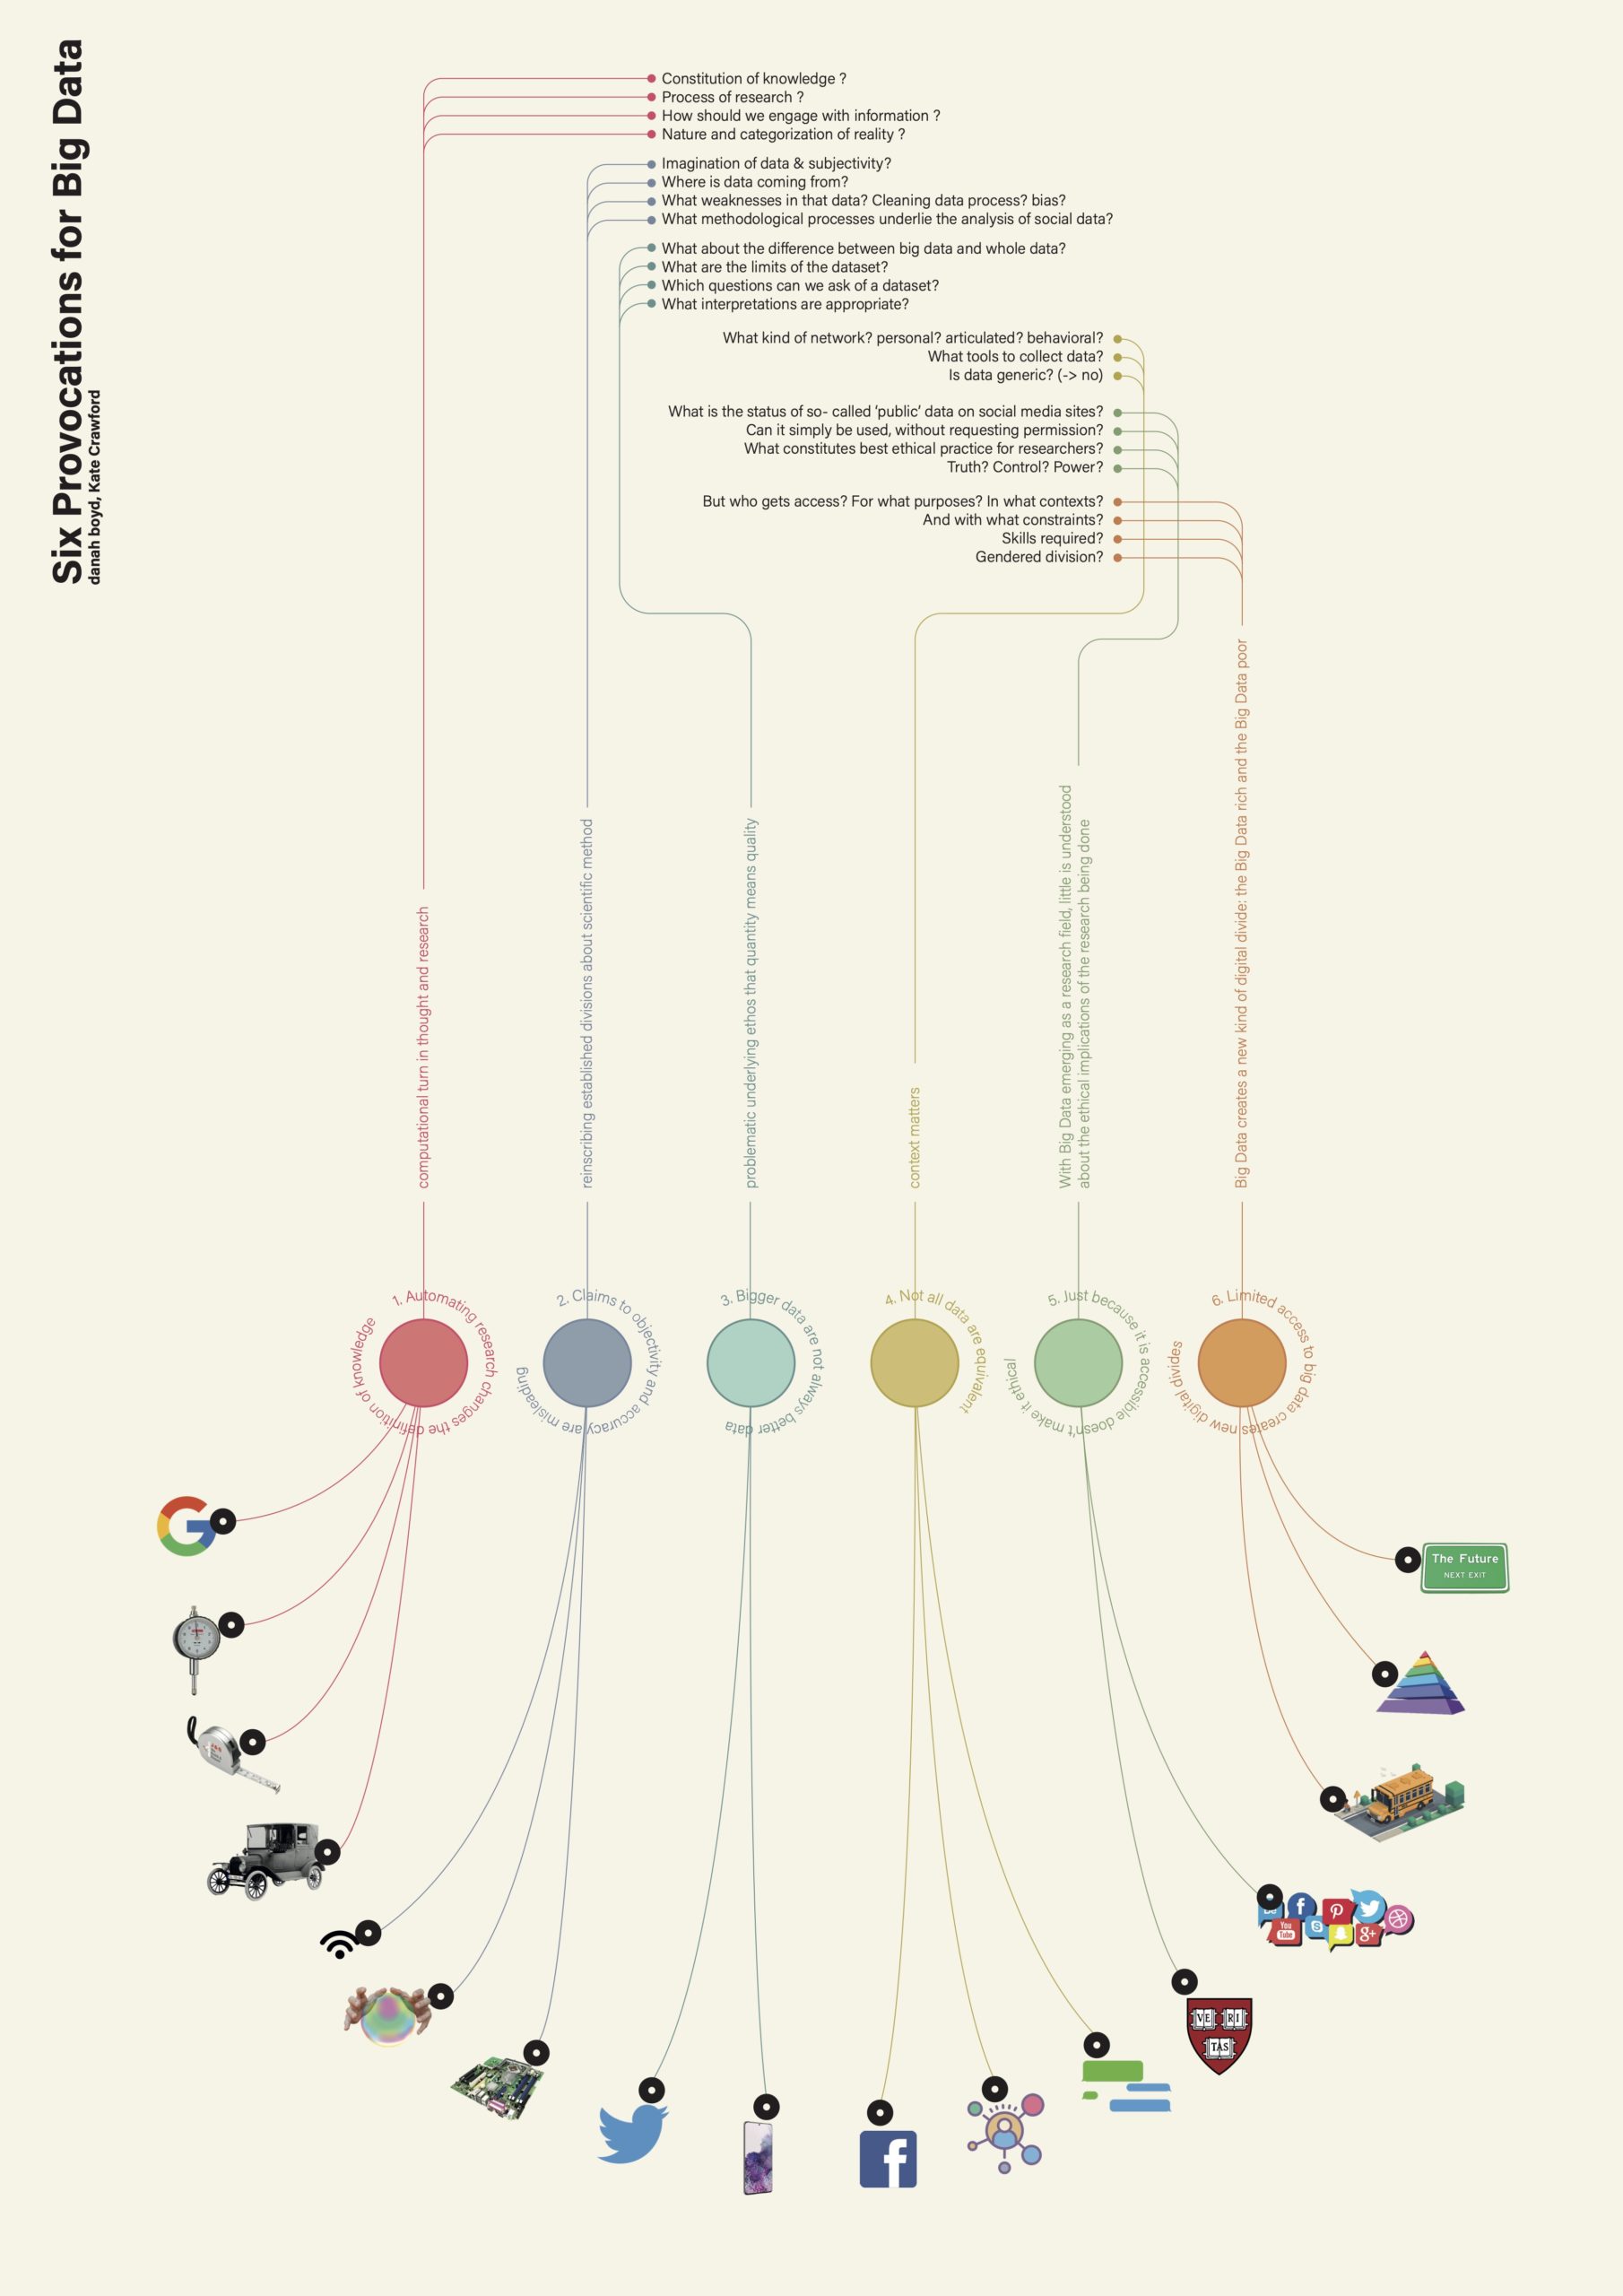
La visualisation des données peut être pour le meilleur ou pour le pire. C’est pourquoi la compréhension de ses piliers est au cœur de la traduction du texte en langage visuel. A la croisée du design et d’une approche plus littéraire, ces visualisations de données sont le résultat d’un processus de compréhension toujours différent, en fonction du texte lui-même, et de la forme choisie.
Un processus de recherche basé sur des données.
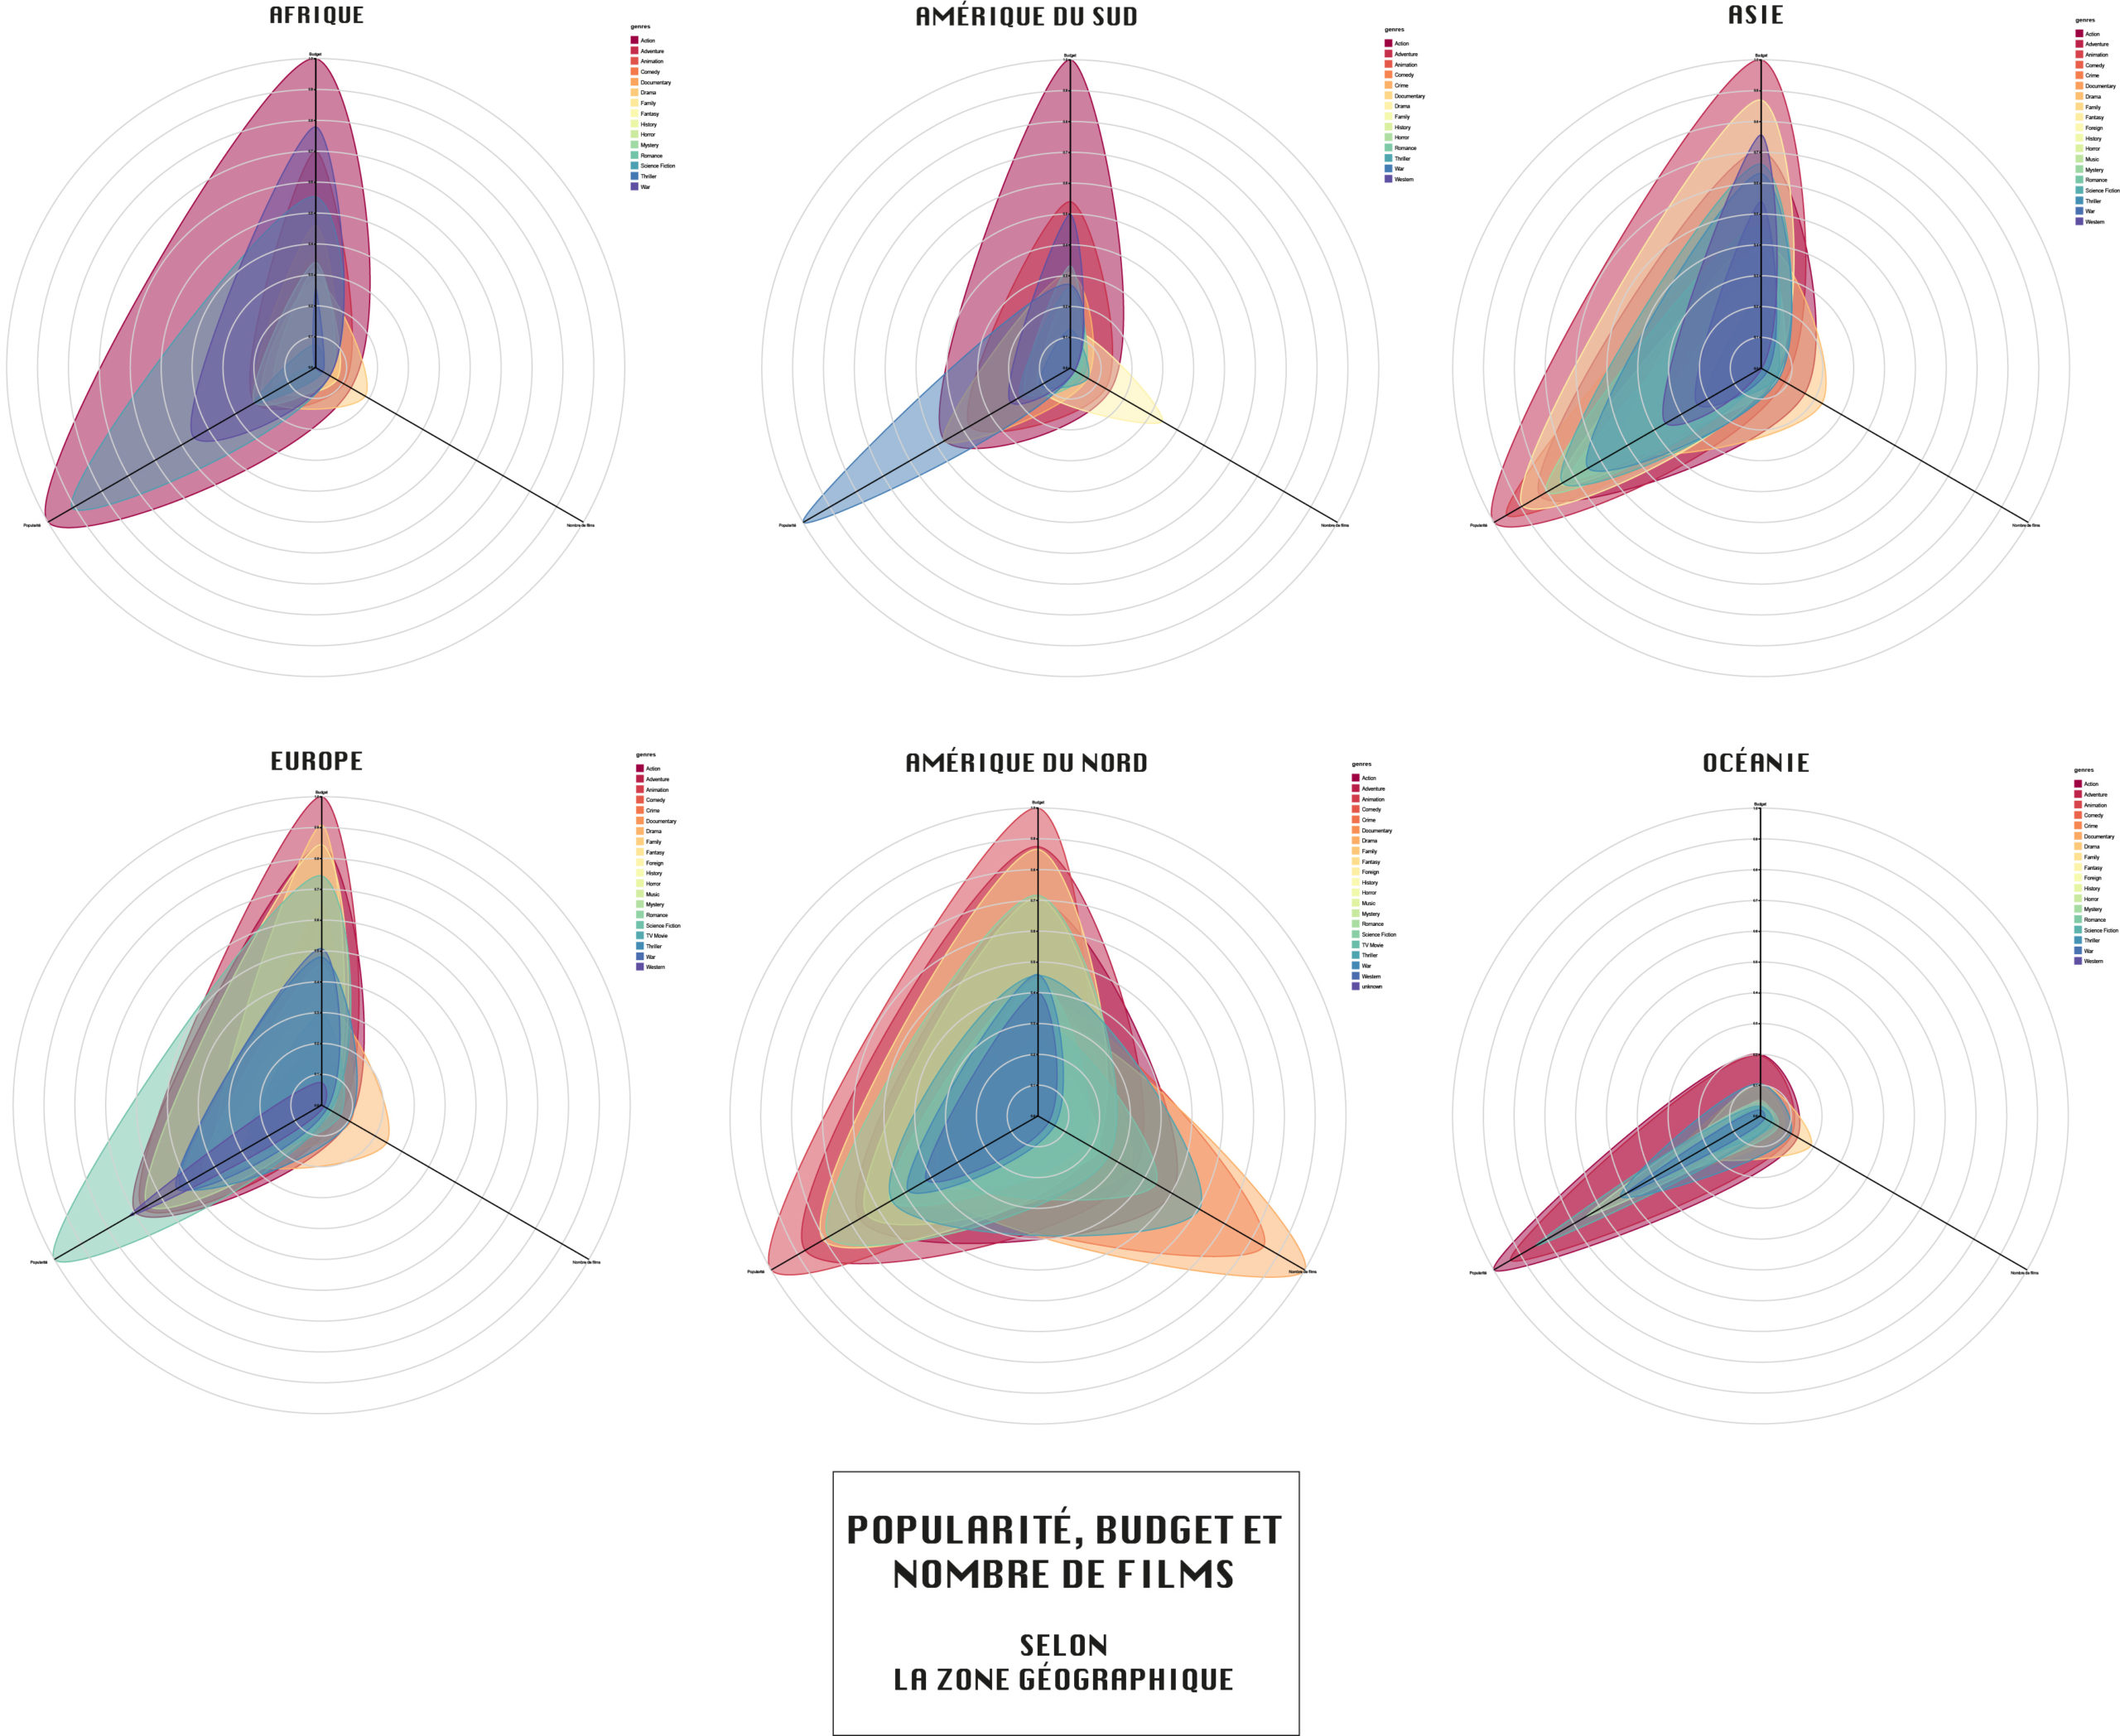
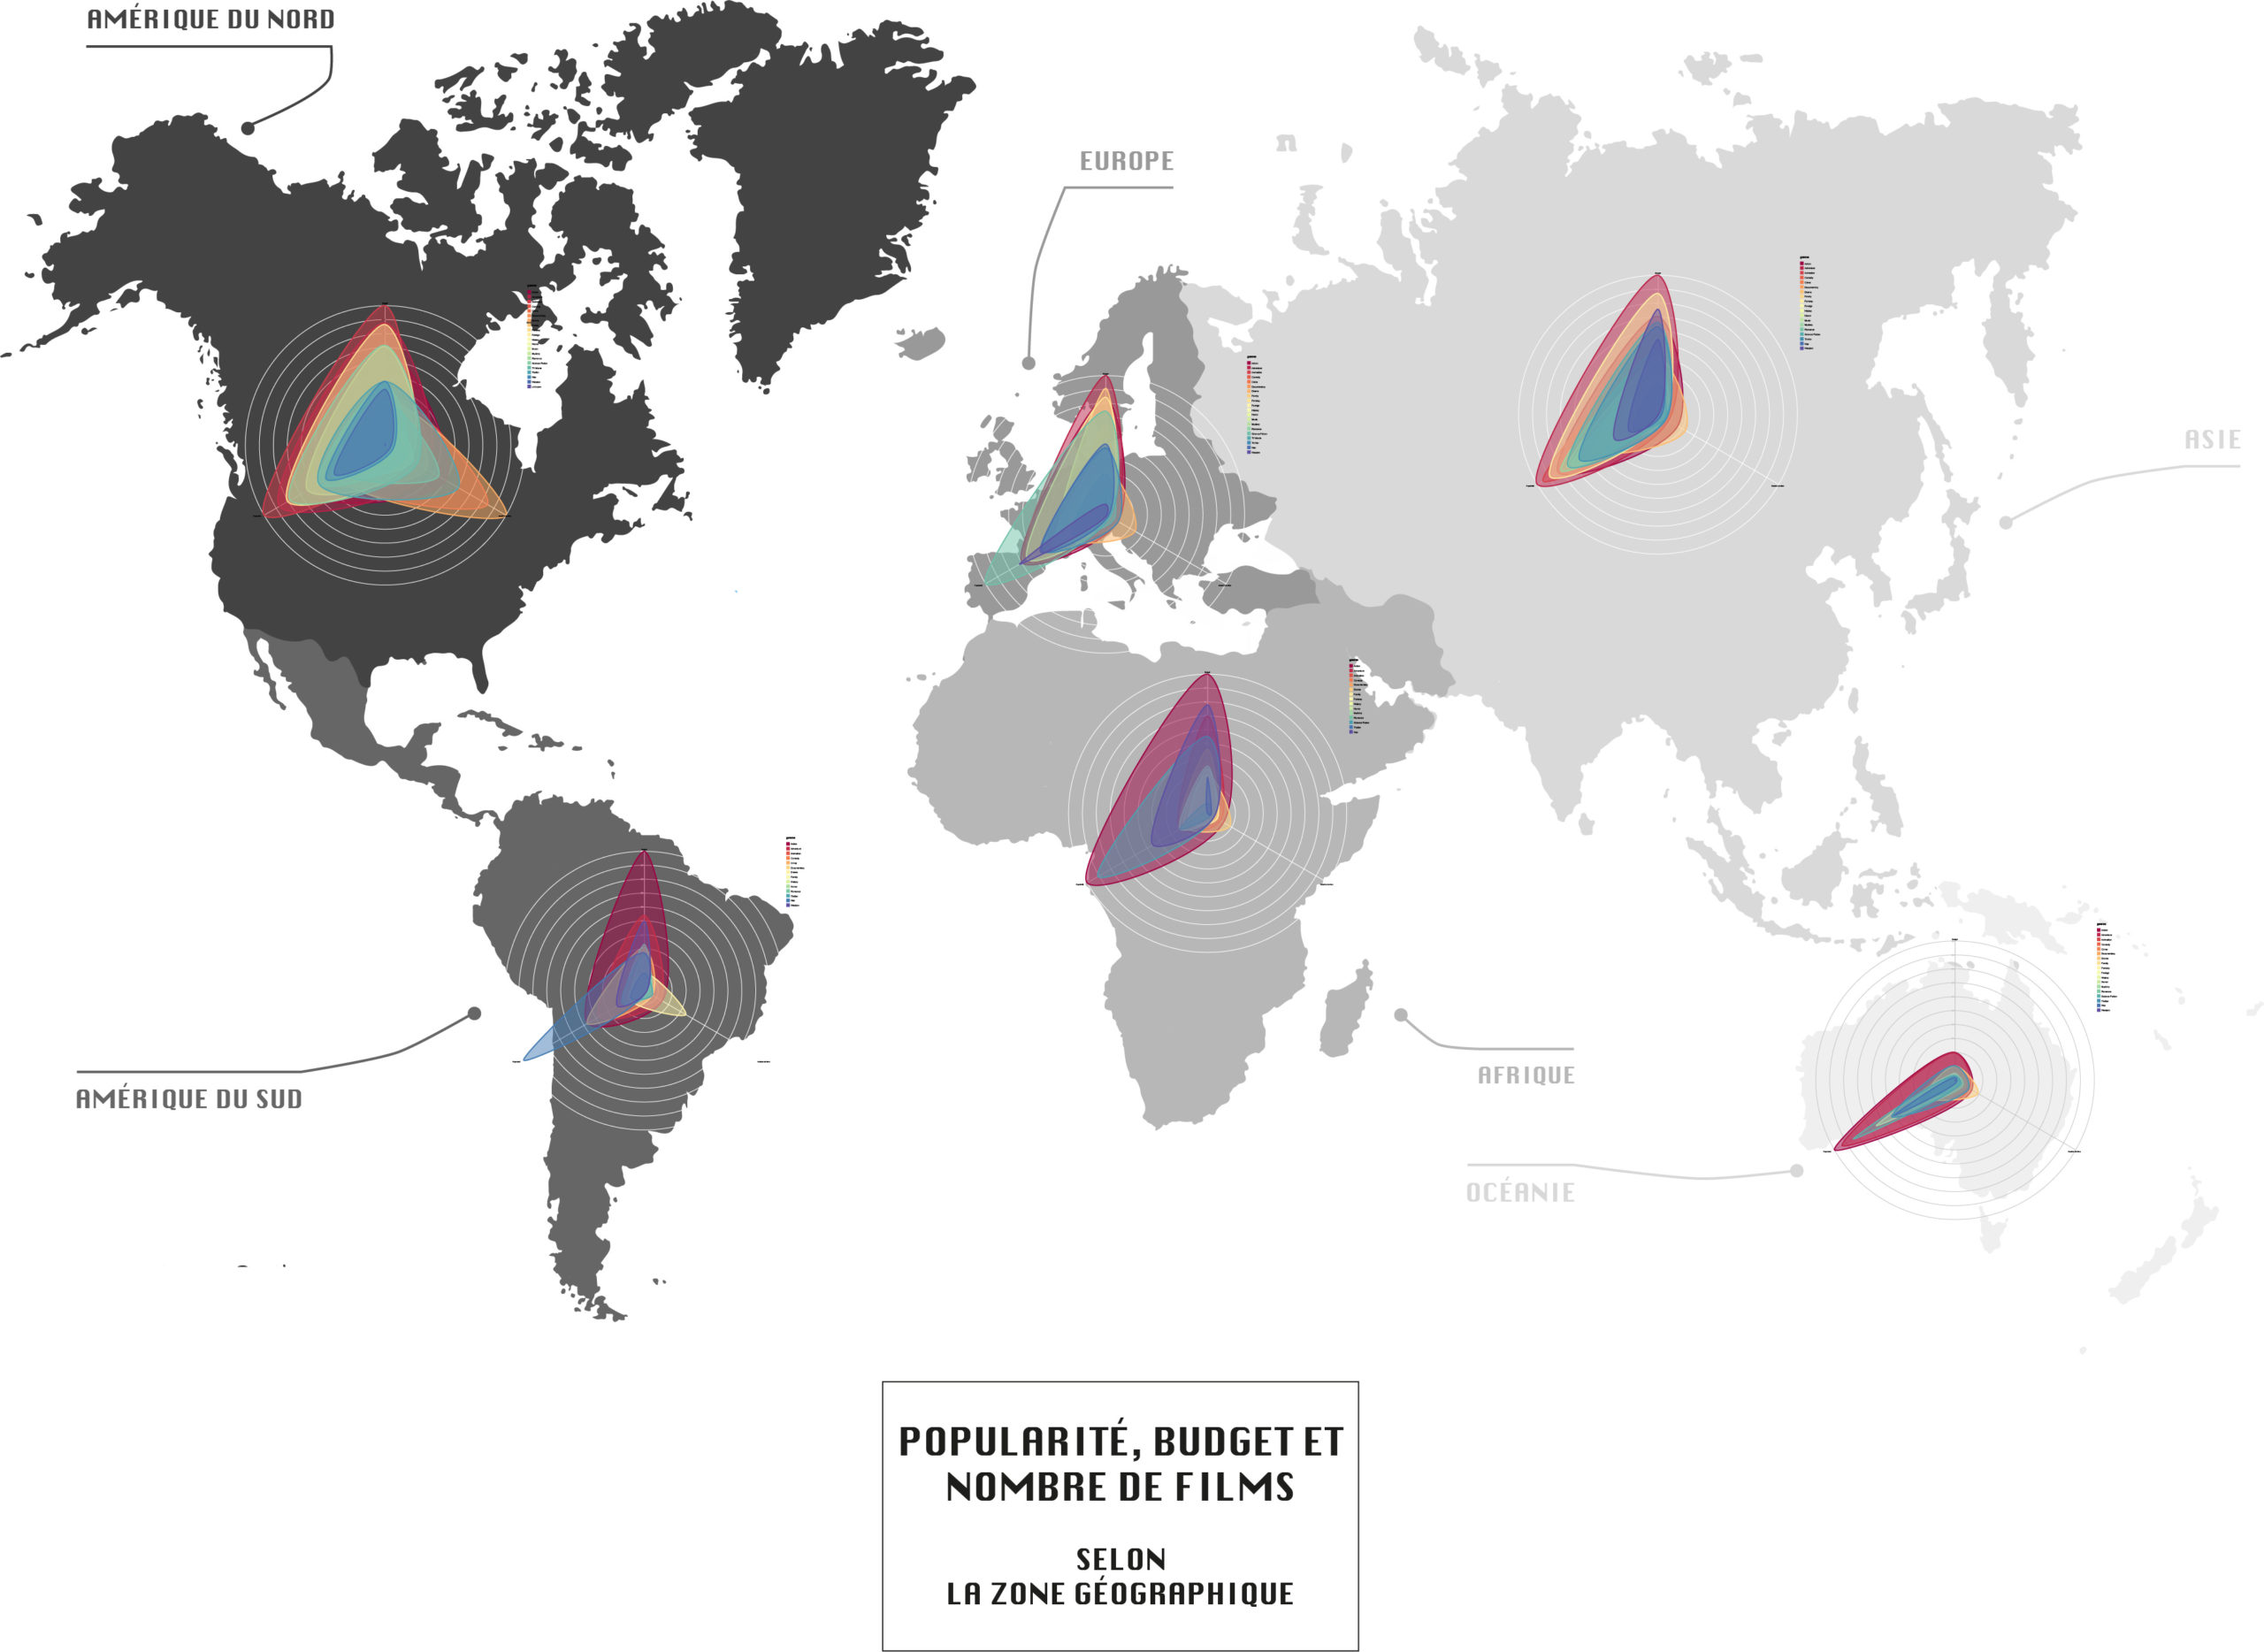
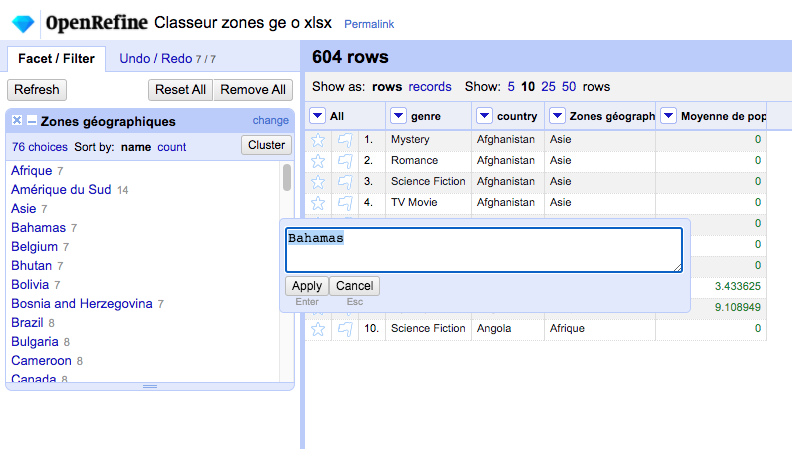
Nous avons exploré une vaste base de données rassemblant des informations sur environ 4 000 films. Des chiffres et du texte à la visualisation des données, nous avons utilisé des outils tels que RawGraph et OpenRefine pour répondre à des questions telles que : Qu’est-ce qu’un film populaire ? Quelles sont les caractéristiques des films populaires ? Comment la popularité évolue-t-elle en fonction des zones géographiques ? Comment la popularité évolue-t-elle dans le temps ?